


اسپننگ ٹاپ کینڈل اسٹک کیسے کام کرتی ہے؟
اسپننگ ٹاپ اور ڈوجی کے درمیان فرق
اسپننگ ٹاپ کینڈل اسٹک کے لیے استعمال کی غرض سے بہترین ٹائم فریم کیا ہے؟
فاریکس ایک اتار چڑھاؤ کی مارکیٹ ہے جہاں چارٹ پر مختصر سی حرکت بھی ٹریڈ کو نمایاں طور پر متاثر کر سکتی ہے۔ ٹریڈرز کو چاہیے کہ وہ مارکیٹ کے رویے کا حقیقی وقت میں تجزیہ کرنے کے لیے قابل اعتماد ٹولز استعمال کریں جس سے کم از کم خطرہ ہو۔ اسپننگ ٹاپ کینڈل اسٹک مارکیٹ کے رجحانات کو ٹریک کرنے کے لیے موثر ترین کینڈلز میں سے ایک ہے۔
1. اسپننگ ٹاپ
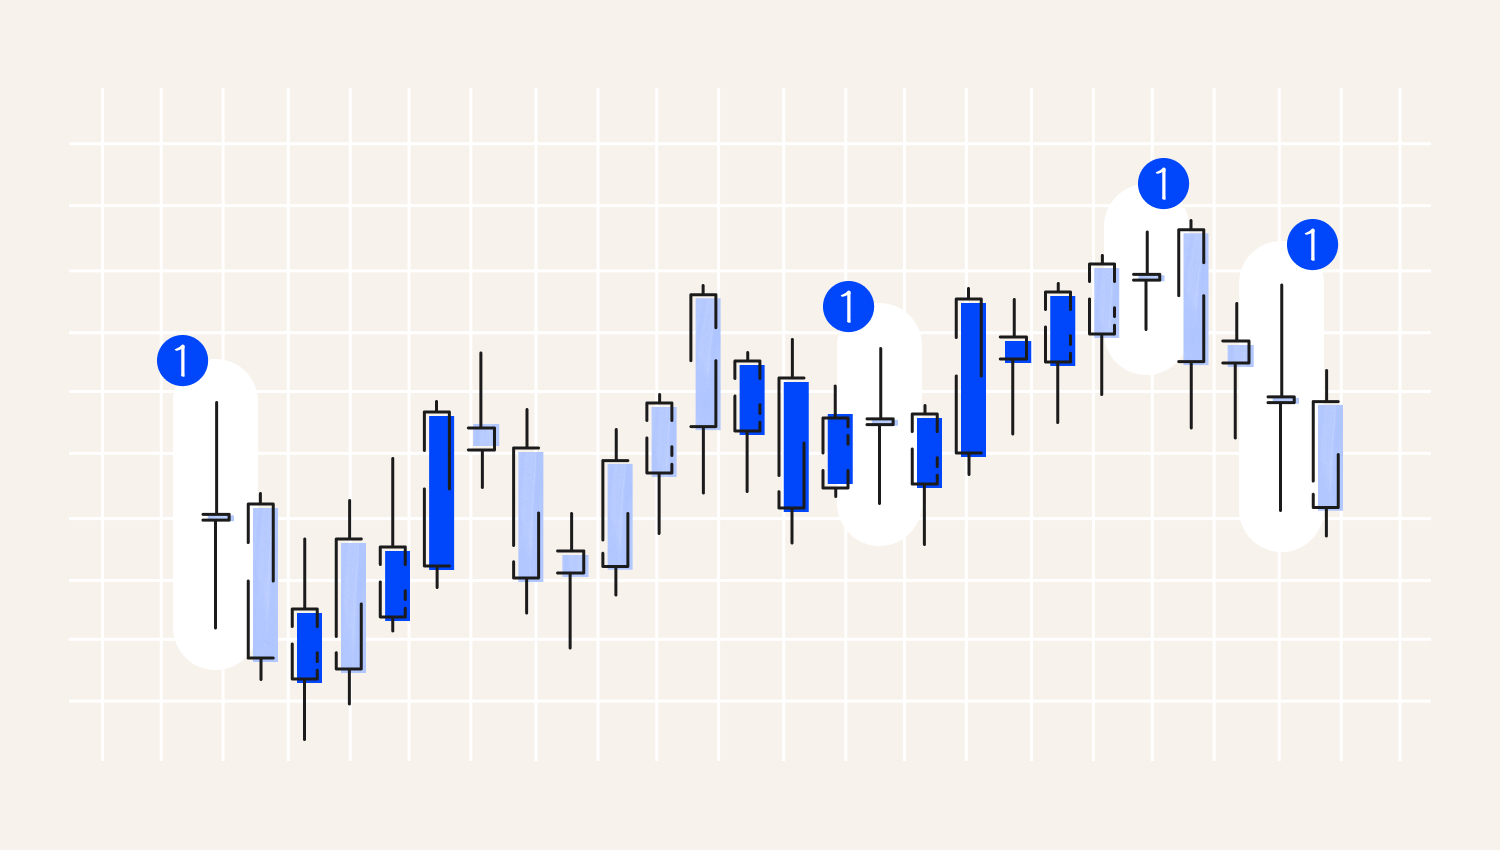
اسپننگ ٹاپ کینڈل اسٹک ایک تکنیکی تجزیاتی پیٹرن ہے جو مارکیٹ کے غیر یقینی پن کو ظاہر کرتی ہے۔ اس کی بنیادی خصوصیات یہ ہیں:اسپننگ ٹاپ کینڈل اسٹک کیا ہے؟
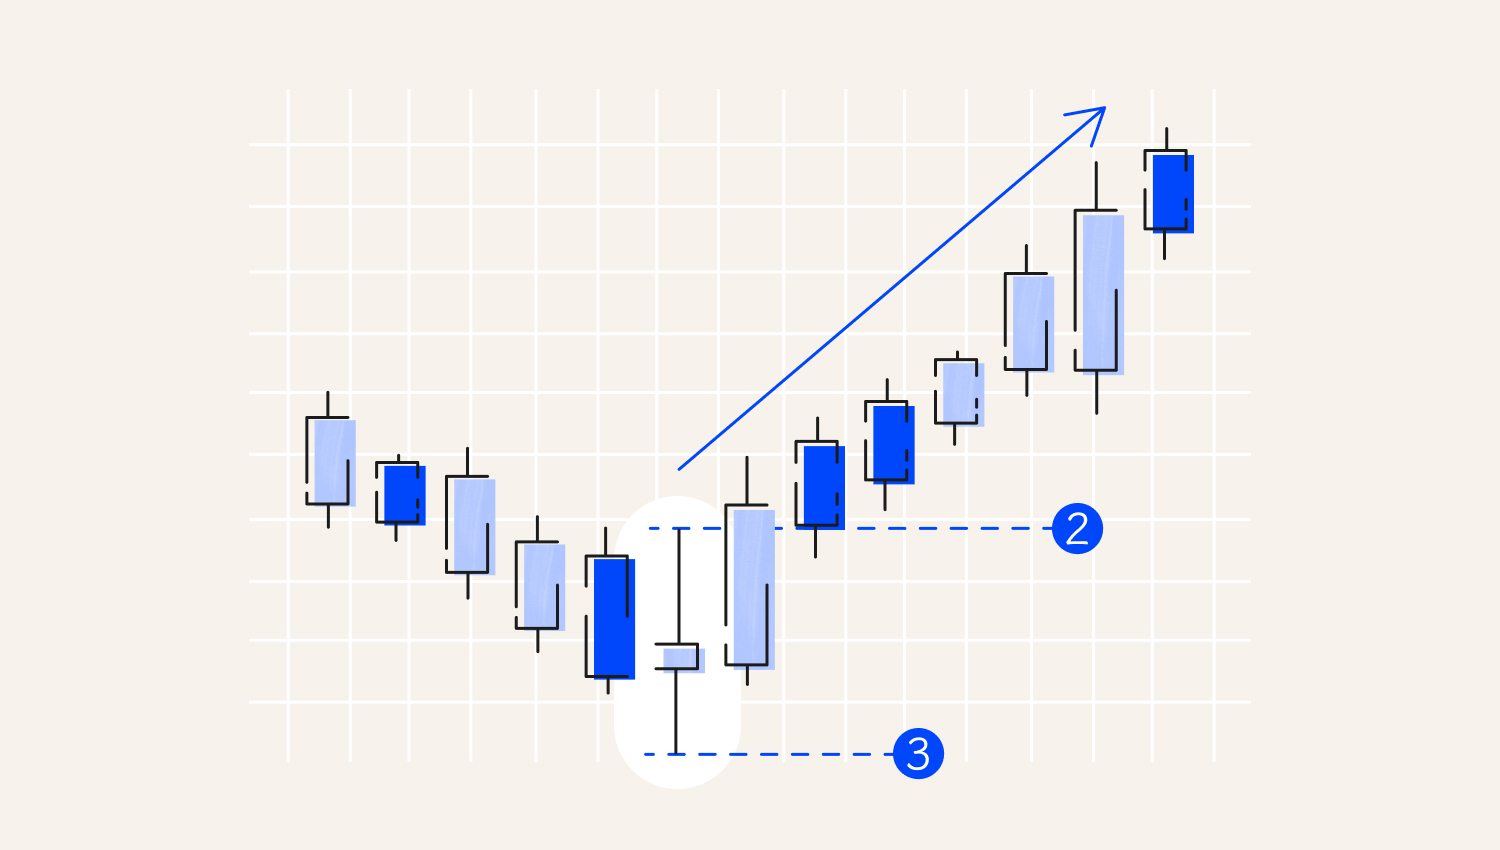
1. انٹری لیول
2. اسٹاپ لاس
دیگر تجزیاتی ٹولز کے ساتھ ملا کر، اسپننگ ٹاپ ٹریڈرز کو یہ سمجھنے میں مدد کر سکتا ہے کہ آیا ٹریڈ جاری رکھنی ہے یا پوزیشن کو بند کرنا ہے۔
مارکیٹ میں غیر یقینی کی صورت حال میں اسپننگ ٹاپ کینڈل اسٹک ظاہر ہوتی ہے، یعنی:اسپننگ ٹاپ کینڈل اسٹک کیسے کام کرتی ہے؟
In trading, both the Spinning Top and Doji are the candlestick patterns of technical analysis that signal market uncertainty. Despite the common goal they pursue, there are some differences in their structure and interpretation: Before engaging in Forex trading, it's crucial to thoroughly understand the differences between the Spinning Top and Doji patterns. This knowledge will ensure that traders are well-informed and prepared to make sound decisions and execute successful transactions.Difference between Spinning Top and Doji
Characteristics
Spinning Top
Doji
Body
It has a small body that indicates a slight difference between the opening and closing prices. Usually, the body is located at the top or bottom of the price range.
Doesn't have a body, or its body is too small, close to invisible. The opening and closing prices are almost the same. A Doji candlestick looks like a simple vertical line or a cross.
Shadows
Upper and lower shadows are always long.
Shadows can be long or short.
Signals
Indicates uncertainty in the market, with some degree of volatility. Sometimes, it can be used as a signal of a possible reversal or price consolidation.
Due to the absence of a body, Doji may be a stronger signal of uncertainty than Spinning Top.
Potential of using
Using the Spinning Top candlestick pattern, traders can swiftly analyse potential fluctuations and determine entry and exit points, empowering them to make confident trading decisions.
A Doji pattern demonstrates apparent neutrality. It can be used as a signal to wait for confirmation of the price direction before opening a trading position.
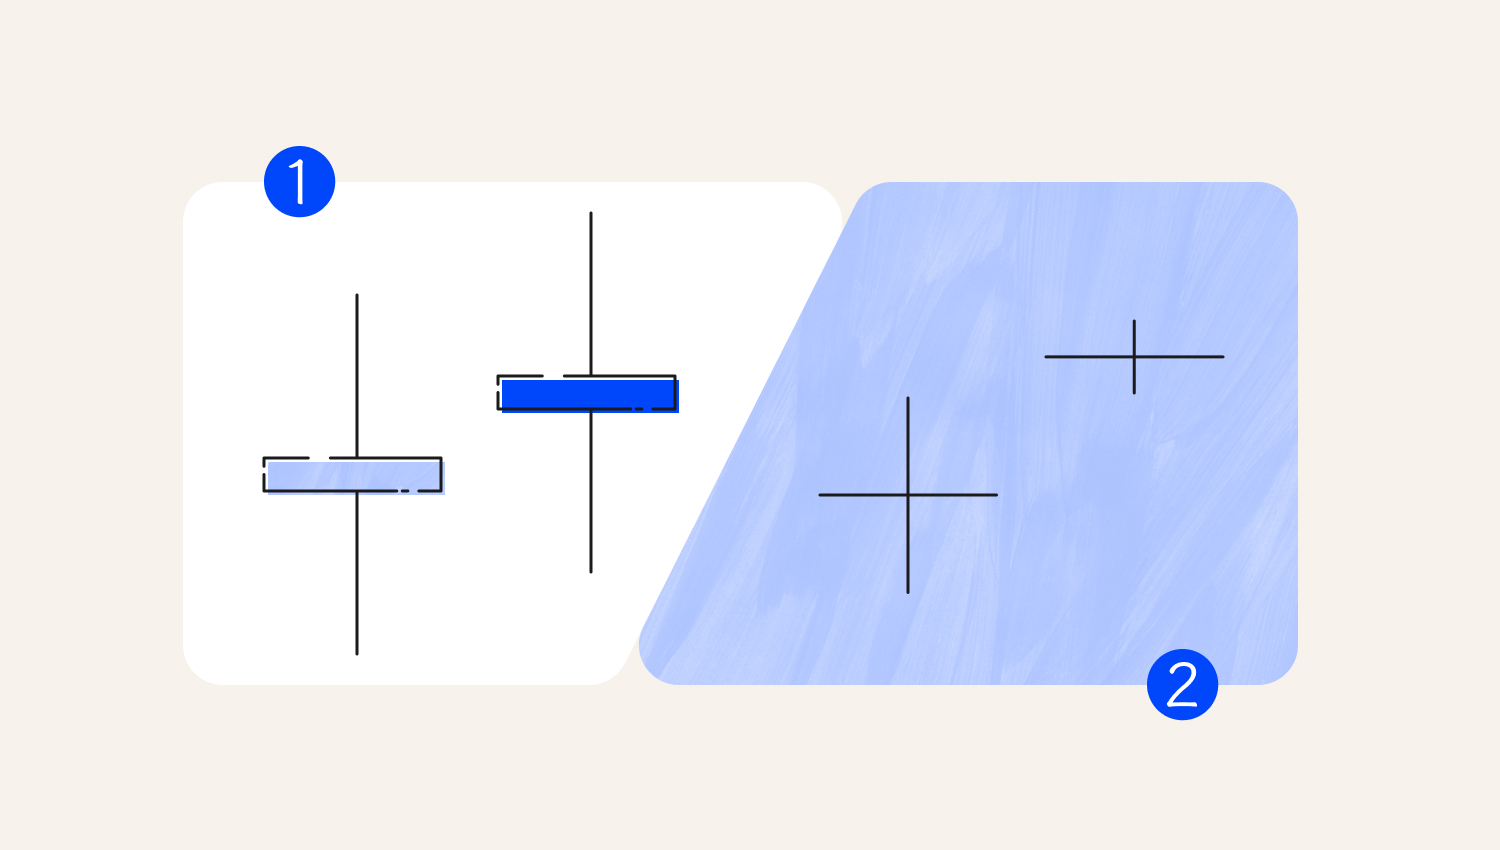
1. Spinning top
2. Doji
The effectiveness of the trading strategy depends on how traders use it. Suppose you carefully analyse the context, apply it to confirmatory signals, and know how to manage risks. In that case, the Spinning Top candlestick pattern will bring you the following benefits: Unfortunately, beginners and inexperienced traders who use the pattern for the first time risk getting an inaccurate analysis due to several disadvantages of the method:Pros and cons
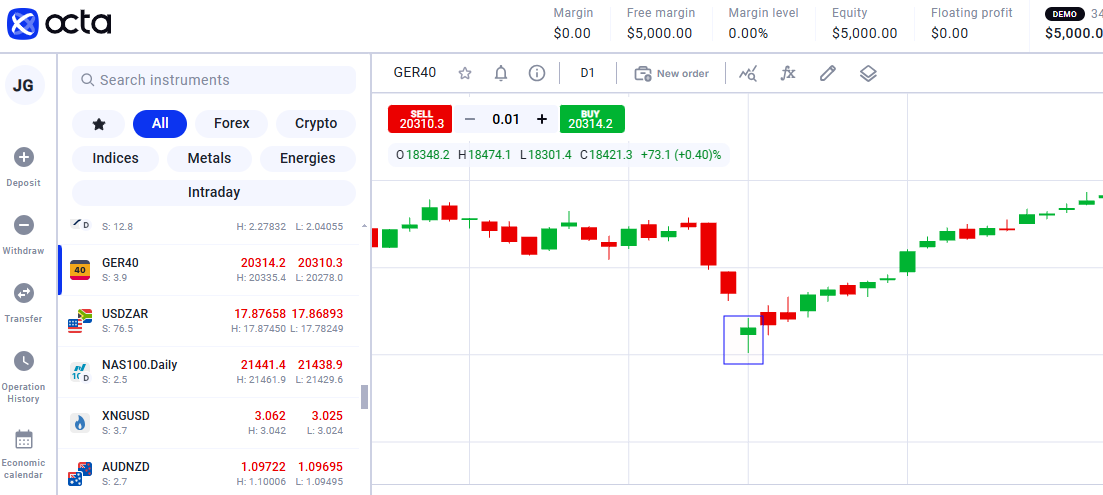
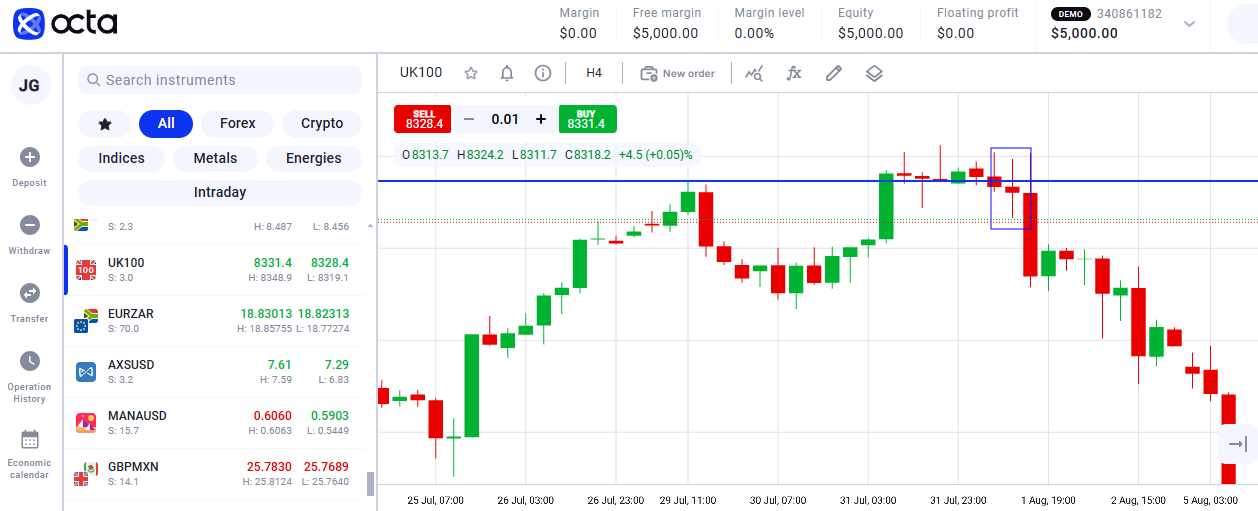
Imagine that on the daily chart of the GBPAUD currency pair, the market trend has been bullish over the past few days. However, the Spinning Top candlestick appeared on the chart on the day. The candlestick has a small body and long upper and lower shadows, indicating significant price fluctuation during the day. Despite this, the closing and opening prices are almost equal. Here are the main characteristics of the candle: Now, let's take a look at the pattern's interpretation: If the price continues to rise for several days, but the fluctuations are already visible on the chart, this may indicate an upcoming change in direction. There is a strong possibility of a trend reversal in the coming days.Example
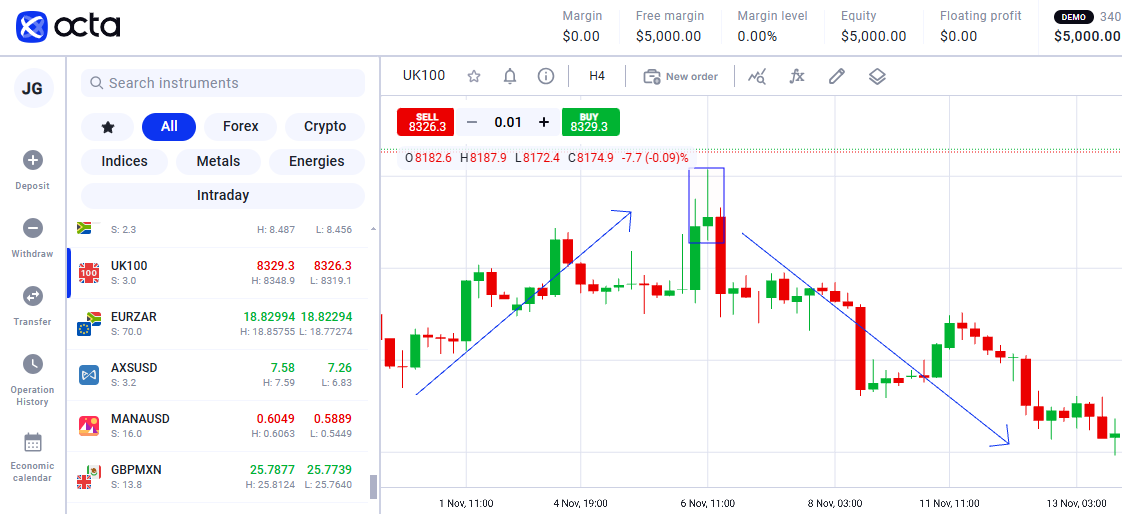
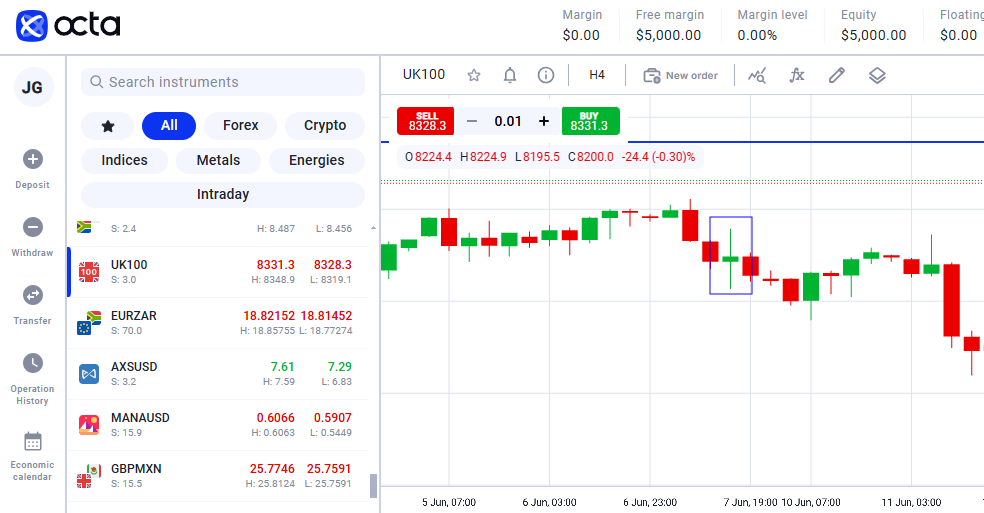
Most experts say that the Spinning Top candlestick pattern works best in the timeframe of daily bars. This model is effective for several reasons: However, it would help if you chose a suitable timeframe based on your trading strategy. Use weekly charts to identify significant market trends if you are a long-term trader. Those who prefer intraday trading should turn to hourly charts since they can identify short-term signals more clearly. A more versatile option is a four-hour chart. It provides enough information for analysis and is suitable for short—and medium-term trading.What is the best timeframe to use for the Spinning Top candlestick?
Final thoughts
