Confirming you are not from the U.S. or the Philippines

یہ بیان دے کر، میں واضح طور پر یہ بتاتا اور تصدیق کرتا ہوں کہ:
  • میں امریکی شہری یا رہائشی نہیں ہوں
  • میں فلپائن کا رہائشی نہیں ہوں
  • میں بالواسطہ یا بلاواسطہ امریکی باشندوں کے 10 فیصد سے زیادہ شیئرز/ ووٹنگ کا حق/ امریکی باشندوں کے انٹرسٹ کا مالک نہیں ہوں اور/یا دوسرے ذرائع سے امریکی شہریوں یا رہائشیوں کو کنٹرول نہیں کرتا ہوں۔
  • میں بالواسطہ یا بلاواسطہ امریکی باشندوں کے 10 فیصد سے زیادہ شیئرز/ ووٹنگ کا حق/ انٹرسٹ کا مالک نہیں ہوں اور/ یا کسی دوسرے ذریعے سے امریکی شہری یا رہائشی کے کنٹرول میں نہیں ہوں۔
  • میں FATCA کے سیکشن (a)1504 کے معاملے میں امریکی شہریوں یا رہائشیوں کے ساتھ وابستہ نہیں ہوں
  • میں غلط اعلان کرنے پر اپنی ذمہ داری سے واقف ہوں۔
اس بیان کے مقاصد کے لئے، ریاستہائے متحدہ امریکہ کے تمام منحصر ممالک اور علاقوں کو امریکہ کے مرکزی علاقے کے برابر کردیا گیا ہے۔ میں اپنے اس بیان کی خلاف ورزی سے پیدا ہونے یا اس سے متعلق ہونے والے کسی بھی دعوے کے خلاف، بے ضرر آکٹا مارکیٹس انکارپوریٹڈ، اس کے ڈائریکٹرز اور افسران کا دفاع کرنے کا عہد کرتا ہوں۔
ہم آپ کی رازداری اور آپ کی ذاتی معلومات کے تحفظ کے لیے وقف ہیں۔ ہم محض اپنی پراڈکٹس اور سروسز کے متعلق خصوصی پیشکشوں اور اہم معلومات فراہم کرنے کے لیے ای میلز اکٹھا کرتے ہیں۔ اپنا ای میل ایڈریس دے کر، آپ ہم سے ایسے ای میلز وصول کرنے پر اتفاق کرتے ہیں۔ اگر آپ انسبسکرائب کرنا چاہتے ہیں یا کوئی سوالات یا خدشات ہوں تو، ہماری کسٹمر سپورٹ کو لکھیں۔
Octa trading broker
ٹریڈنگ اکاؤنٹ کھولیں
Back

GBP/USD Price Analysis: Bears seek a break of structure while price slows below 1.2200

  • GBP/USD bulls could be tiring at this juncture.
  • Bears need to break the 1.2140 structure to cement the bearish case for the day ahead. 

GBP/USD has run up towards an area of potential resistance area on the daily chart as the following will illustrate. This gives rise to the prospects of a significant correction over the coming week:

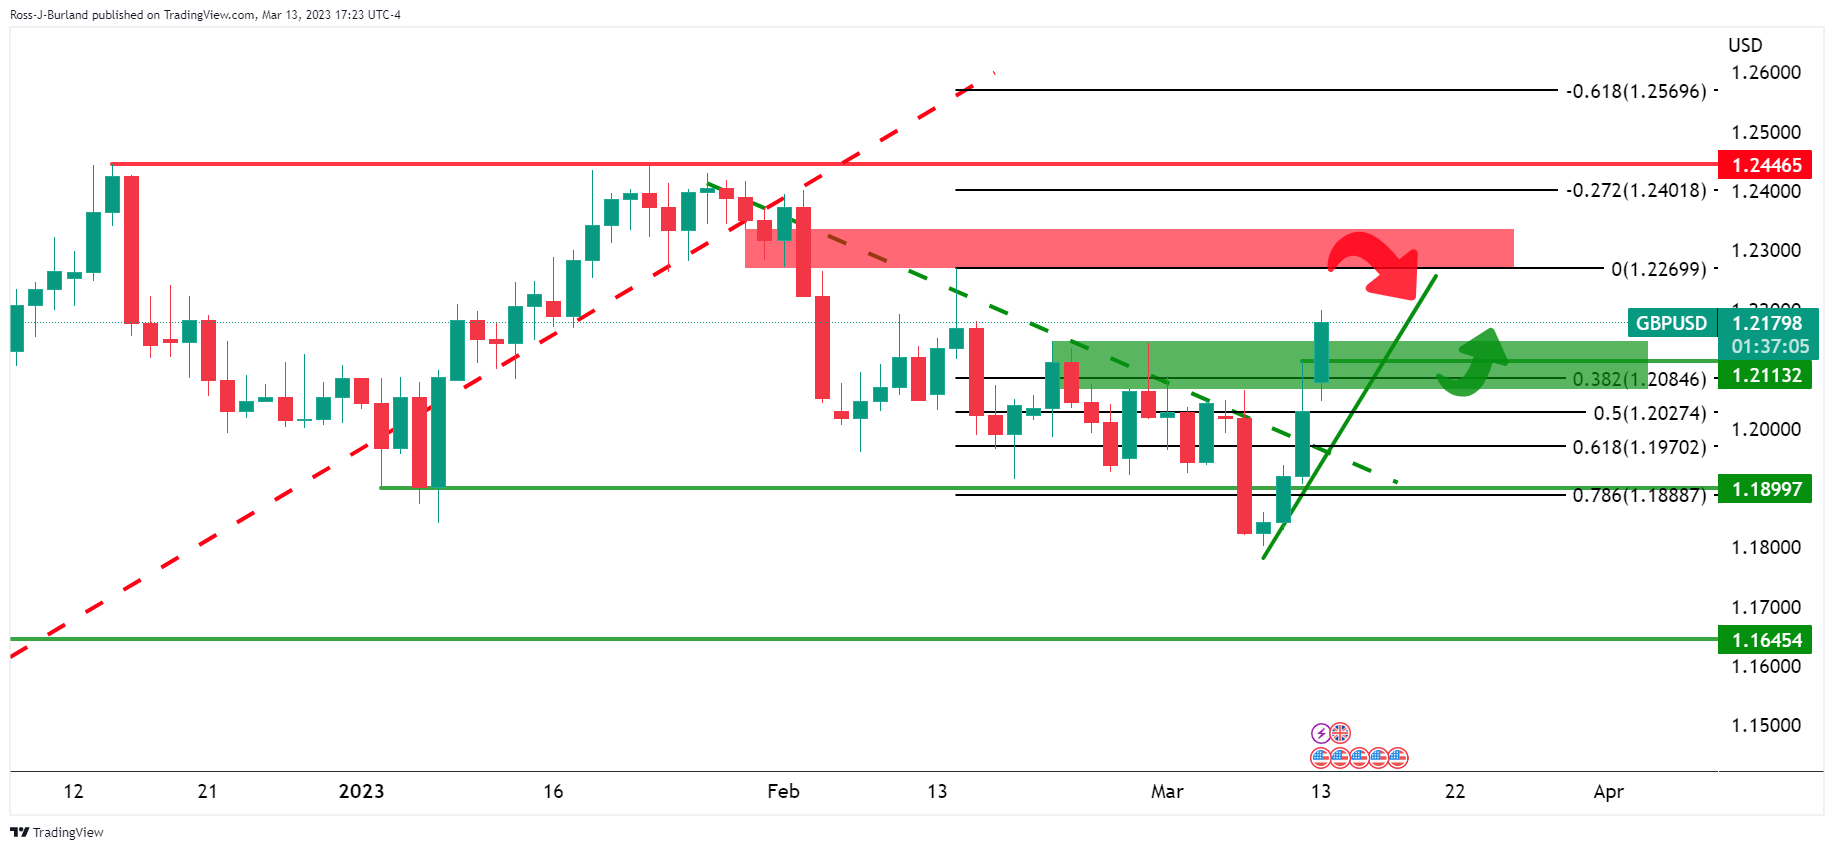
Drawing the Fibonacci from a presumed level where there could be resistance if the price were to continue higher over the next day or so, a 38.2% Fibonacci retracement level comes in near the 1.2080s as potential support. 

At this point, however, drawing the Fib from current highs, the 38.2% comes in at 1.2050. 

GBP/USD H4 chart

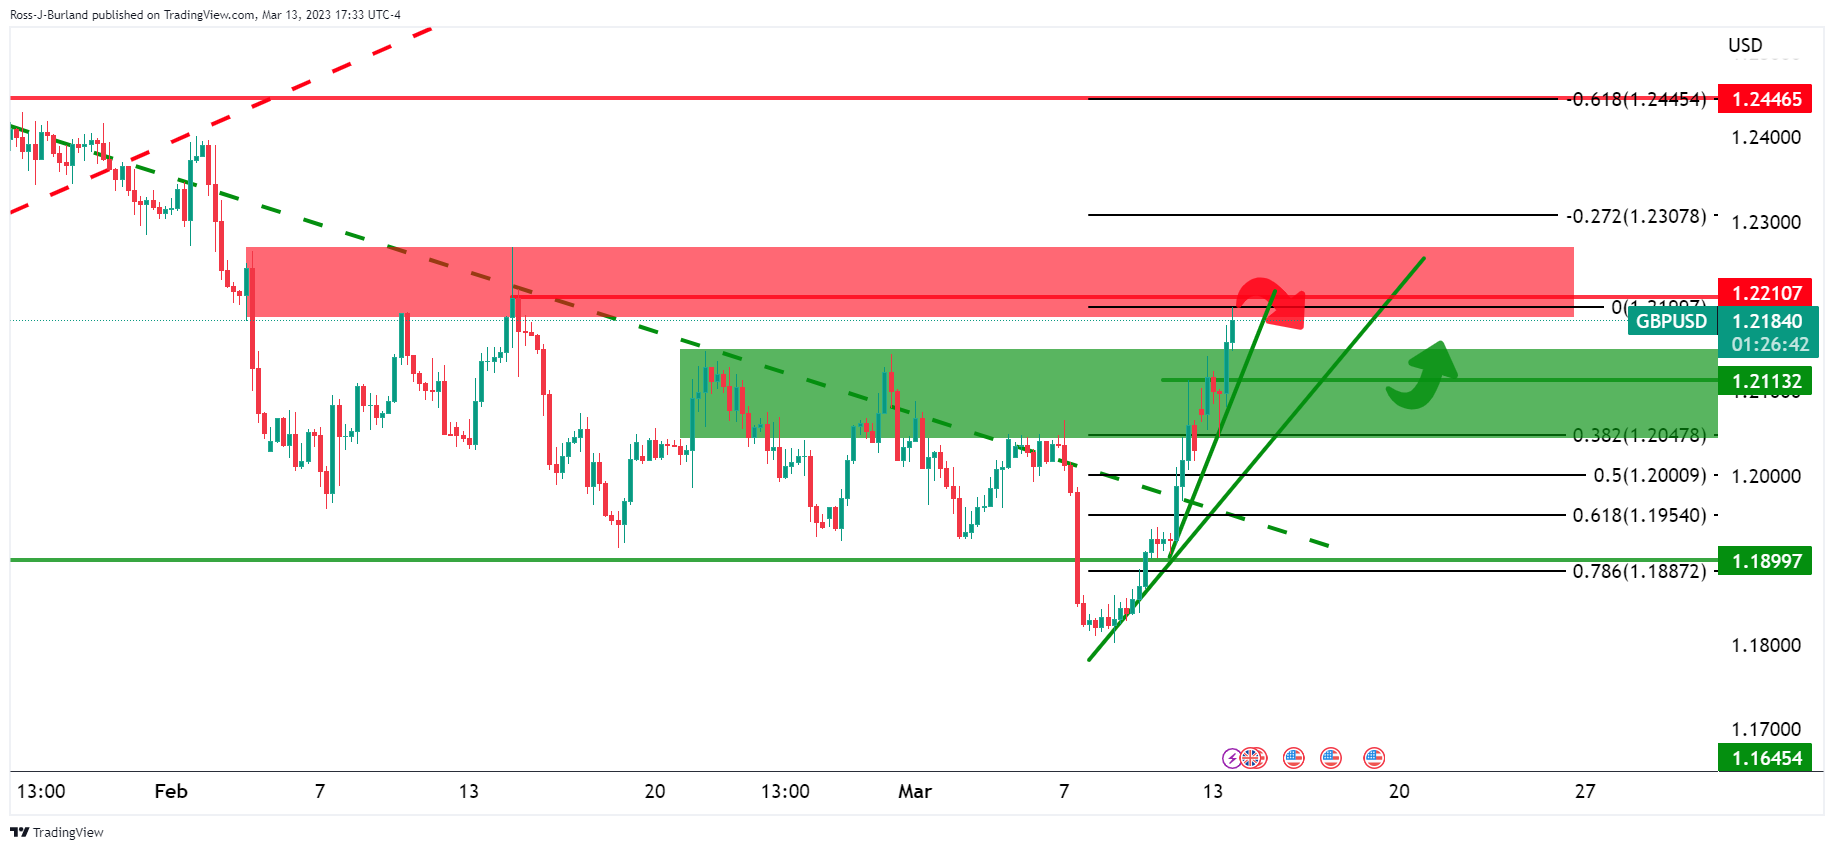
Drilling down to the 4-hour chart, above, there could be a pop to test 1.2200-1.2250 but a subsequent failure and break of the micro-dynamic support will possibly lay the foundations for the anticipated correction.

GBP/USD H1 chart

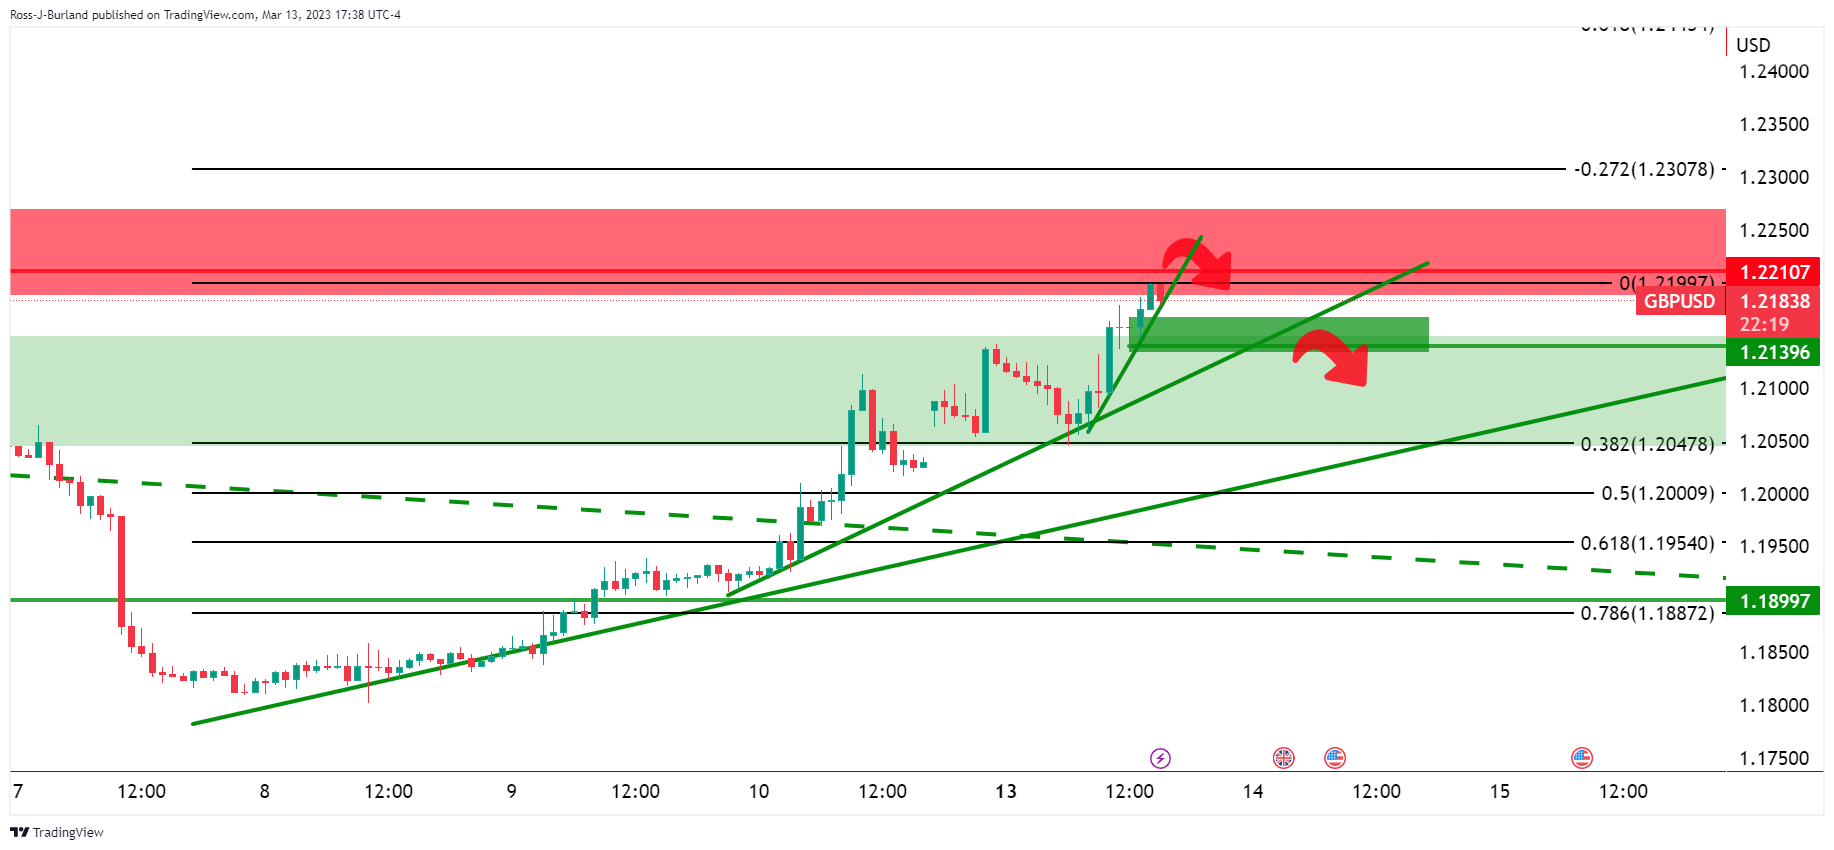
Meanwhile, the price is still very much on the front side of the trend. However, the hourly micro trendline is now under some pressure adding substance to the corrective bias at this point. A break of the 1.2140 structure is needed to cement the bearish case for the day ahead. 

WTI falls on US banking fears amidst a soft US Dollar

Western Texas Intermediate (WTI), the US crude oil benchmark, dropped more than 2% on risk-off impulse, with a bank crisis in the United States (US) r
مزید پڑھیں Previous

South Korea Export Price Growth (YoY) came in at -2.7%, above expectations (-4.8%) in February

South Korea Export Price Growth (YoY) came in at -2.7%, above expectations (-4.8%) in February
مزید پڑھیں Next