Back
28 Feb 2020
USD/CHF Price Analysis: Dollar trading off 17-month lows, remains vulnerable vs. Swiss franc
- USD/CHF is bouncing from its lowest point since September 2018.
- As the up move can be short-lived, the level to beat for bears remains the 0.9680 level
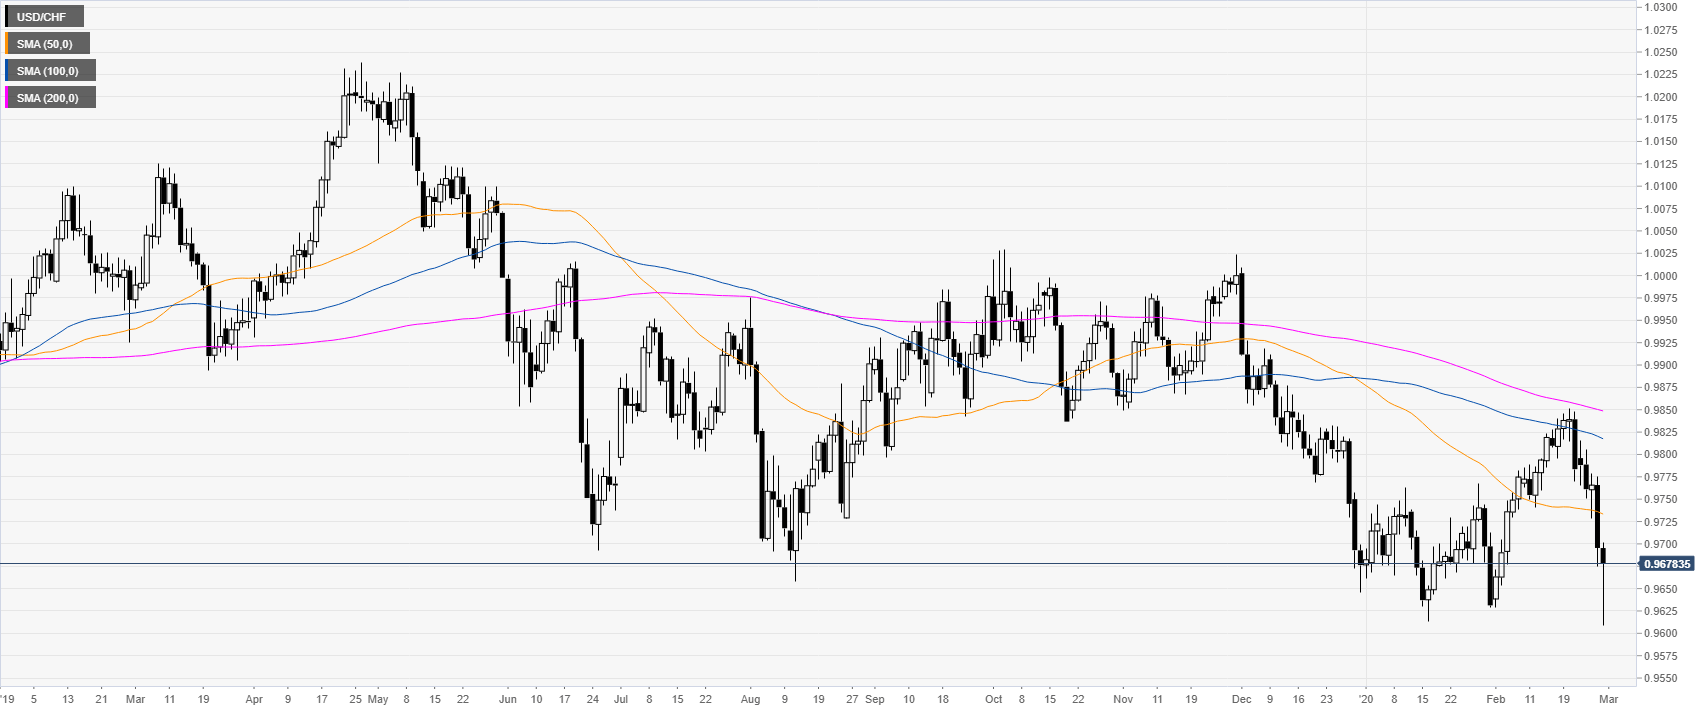
USD/CHF daily chart
USD/CHF is trading below the main daily simple moving averages suggesting an overall bearish momentum in the long term. The spot bounced from 17-month lows however, the sellers should remain in control.
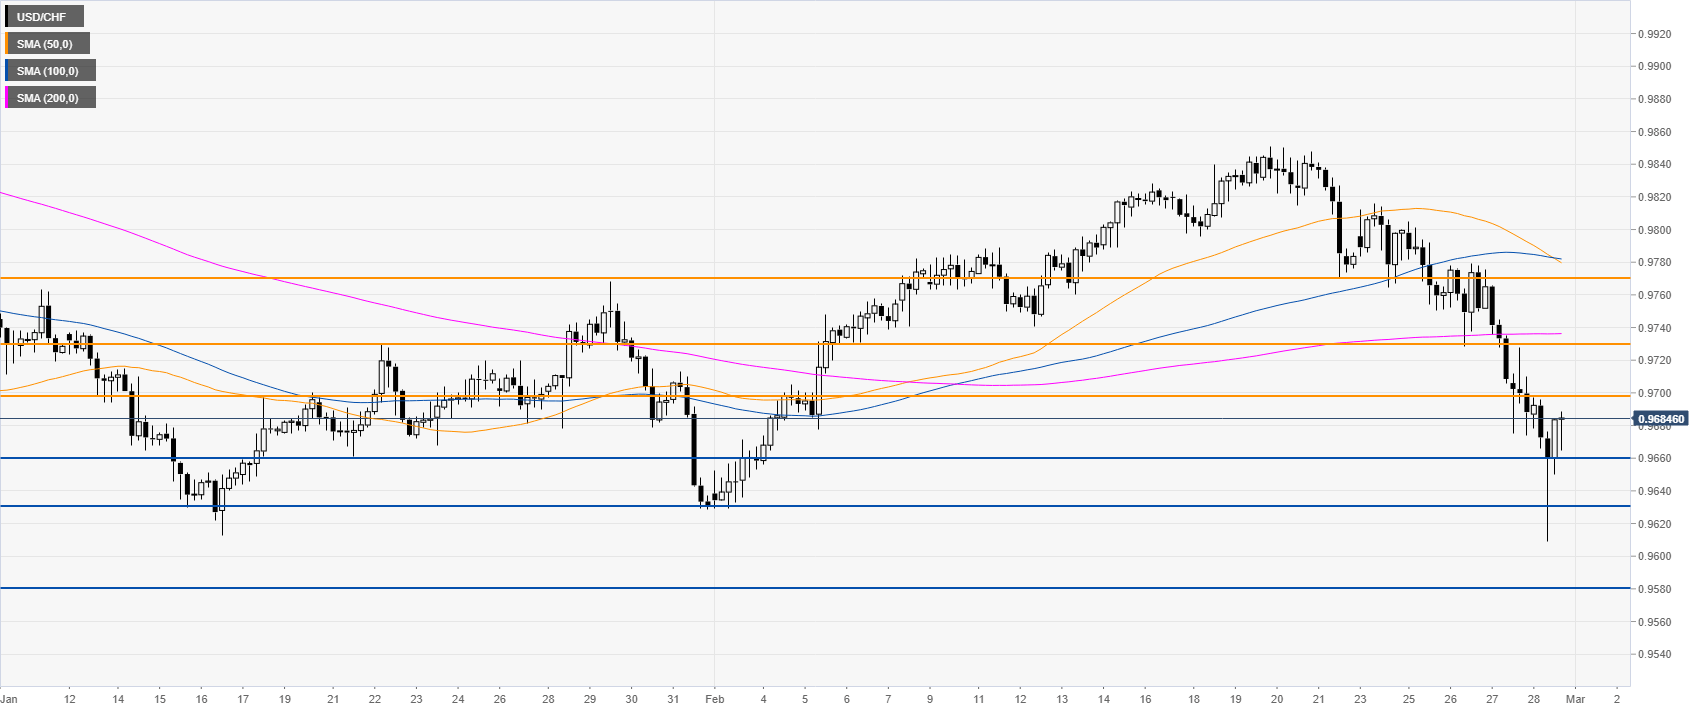
USD/CHF four-hour chart
USD/CHF is consolidating the weekly losses below the 0.9700 figure and the main SMAs on the four-hour chart. Although a correction above 0.9700 cannot be ruled out, the market remains vulnerable to the downside on a break below the 0.9660 level. Potential downside targets could be seen near the 0.9630 and 0.9580 levels while resistance can be expected near 0.9700 and 0.9730 levels.
Resistance: 0.9700, 0.9730, 0.9770
Support: 0.9660, 0.9630, 0.9580
Additional key levels